A system can look fine and still fail quietly. I have seen clear water hide unstable pressure, poor recovery, and drifting quality.
I know a water treatment system is working when it keeps meeting its designed treatment target under the planned flow, pressure, recovery, and water quality conditions over time1. I do not judge it by clear water, good taste, one TDS reading, or one successful test alone.
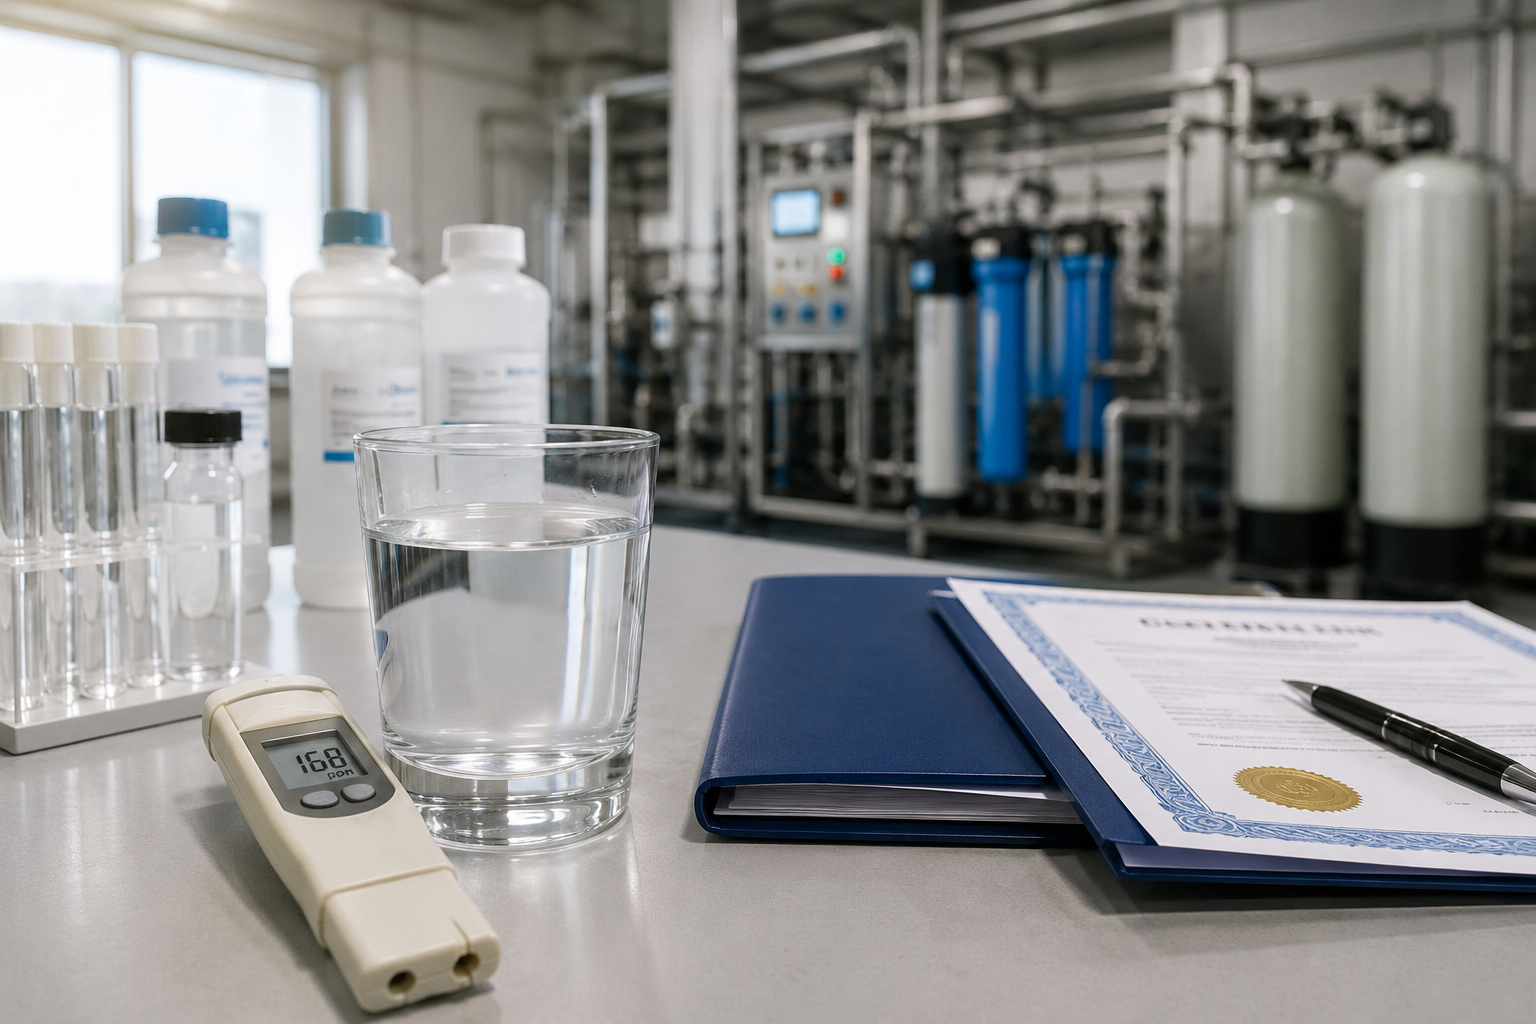
I usually start this question by slowing down the discussion. In project delivery meetings, many people ask, “Is the system working?” I ask back, “Working for which purpose, under which operating condition, and against which acceptance standard?” That change matters. A softener, RO system, UF unit, media filter, EDI system, or combined package plant does not prove performance in the same way. I need the design basis, commissioning records, factory test results, site sampling reports, and daily operating logs before I can give a fair answer.
What does “working” mean for each type of water treatment system?
A wrong standard gives a wrong answer. I have seen teams judge a softener like an RO system and miss the real problem.
A water treatment system is working when its actual results match its treatment goal. I check hardness for softeners2, turbidity or SDI support for filters3, flux and pressure for UF4, desalination and recovery for RO5, and resistivity for EDI6.
I define the treatment goal first
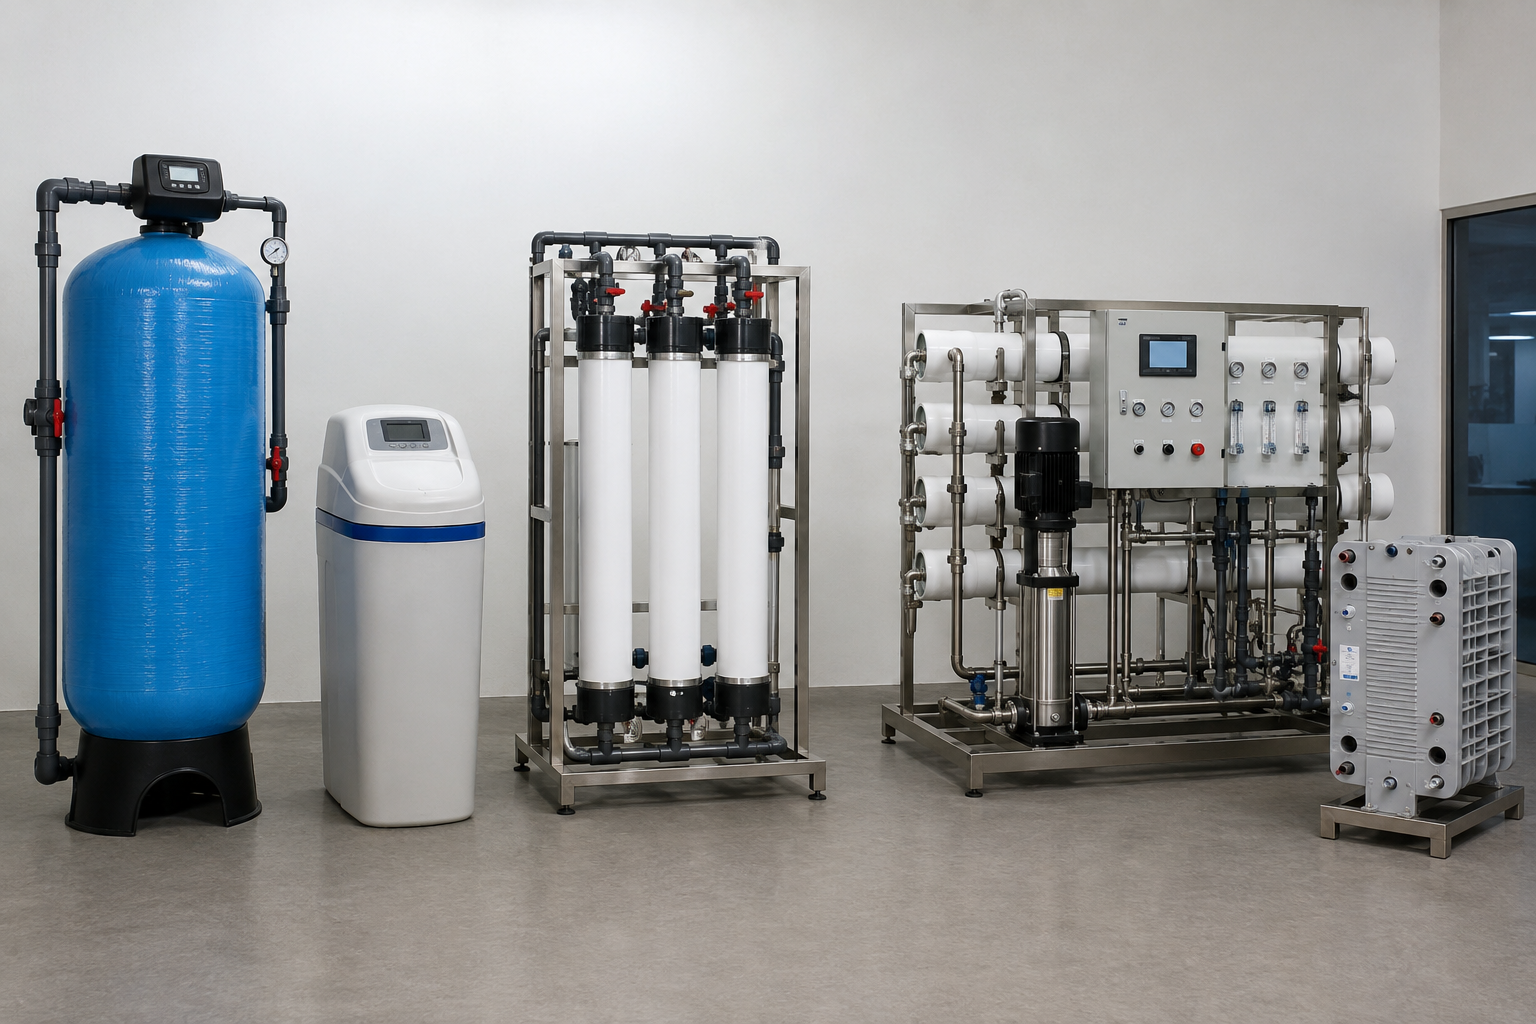
I never use one indicator for every system. I first look at the system type and the reason it was installed. A media filter may be designed to remove suspended solids. A softener may be designed to reduce hardness before a boiler or RO unit. An RO system may be designed to reduce dissolved salts. An EDI system may be designed to produce high-purity water for electronics, laboratories, or pharmaceutical process use. These systems all treat water, but they do not prove success in the same way.
| System type | Main task I check | Common signals I review | A weak judgment I avoid |
|---|---|---|---|
| Media filter | Reduce suspended solids | Inlet and outlet turbidity, pressure differential, backwash record | “The water looks clear.” |
| Water softener | Reduce hardness | Outlet hardness, regeneration record, salt use, flow rate | “The TDS is lower.” |
| UF system | Separate fine particles and microbes by membrane barrier | Permeate flow, TMP, backwash data, turbidity, integrity test if required | “The pump is running.” |
| NF system | Partial salt and organic reduction | Conductivity, rejection rate, pressure, recovery | “The taste is better.” |
| RO system | Remove dissolved salts | Conductivity or TDS, rejection, recovery, pressure, flow | “One TDS test passed.” |
| EDI system | Polish RO water to ultra-pure quality | Resistivity, current, voltage, flow, feed quality | “The RO outlet is acceptable.” |
I also check whether the system is working at the designed load. A system may pass at half flow and fail at full flow.7 It may also pass in the first hour and drift after one week. That is why I do not accept a single number without context.
Which baseline documents should I check before judging system performance?
Missing records create guesswork. I have joined calls where every person had a different “normal” value in mind.
I check design parameters, P&ID, commissioning records, factory test reports, site acceptance documents, water analysis reports, and operating logs. These documents create the baseline for judging whether current performance is normal, drifting, or outside the agreed range.

I use documents to define “normal”
I cannot judge a system only by today’s reading. I need to know what the system was designed to do. In my work with EPC teams, distributors, and project owners, I often see one common problem. The equipment is installed, the water is flowing, and the site team starts asking if the system is working. But the acceptance target is not open in front of them. That makes the discussion weak.
I prefer to place the baseline documents on the table before any conclusion.
| Document | Why I check it | What it tells me |
|---|---|---|
| Design basis | I need the original treatment target | Feed water, product water target, flow, recovery, pressure |
| P&ID | I need to understand the process path | Valve layout, dosing points, instruments, bypass risk |
| Factory test report | I need proof of manufacturing checks | Pressure test, function test, flow check, desalination check when applicable |
| Commissioning record | I need the first site benchmark | Initial pressure, flow, recovery, water quality |
| Site sampling report | I need verified project results | Actual inlet and outlet water quality at site |
| Operating log | I need trend data | Daily changes, alarms, cleaning cycles, abnormal events |
| Acceptance document | I need the agreed pass criteria | Project-specific limits and handover conditions |
I also check whether the instruments were calibrated or at least reviewed during commissioning. A pressure gauge, flowmeter, conductivity meter, or online monitor can mislead the operator if it is not installed correctly. I do not treat documents as paperwork only. I treat them as the map that tells me what the system should look like when it is healthy.
Which operating signals show that the water treatment system is stable?
A system may pass today and fail next month. I look for stable patterns, not one attractive reading.
I review flow rate, inlet pressure, outlet pressure, pressure differential, recovery rate, product water quality, alarms, chemical dosing, regeneration records, and trend changes over time. Stable performance means these values stay within the designed range during normal operation.
I read the system like a moving process
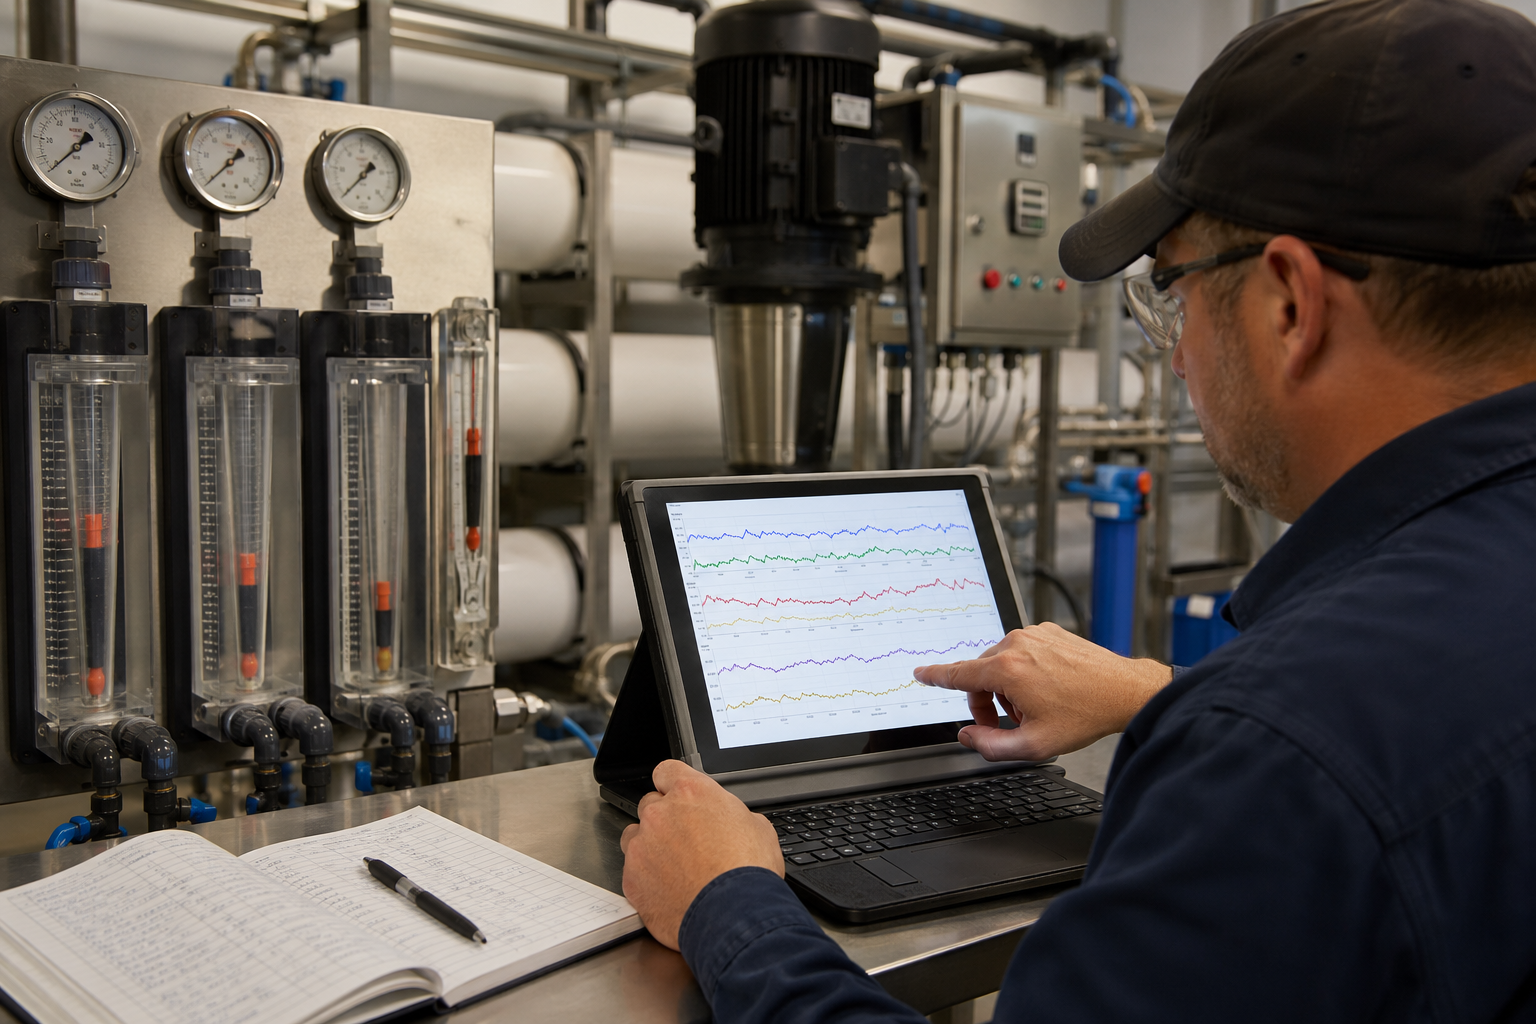
A working system has balance. Water treatment equipment is not only a tank, pump, valve, or membrane. It is a process. When one value changes, another value often responds. For example, an RO system may show a stable product TDS, but the feed pressure may keep rising. That can mean fouling is developing. A media filter may still produce acceptable water, but the pressure differential may grow faster than expected. That can mean the filter bed needs backwash review.
I usually review these signals together.
| Signal | What I look for | Why it matters |
|---|---|---|
| Feed flow | Stable at design range | Low or high flow changes treatment time and membrane loading |
| Product flow | Matches system output target | Falling flow can show clogging, scaling, or pump issues |
| Inlet pressure | Within pump and system design | Abnormal pressure can affect separation and safety |
| Pressure differential | Does not rise too fast | Rising differential can show blockage or fouling |
| Recovery rate | Matches design range | High recovery can increase scaling risk8 |
| Product conductivity or TDS | Stable against target | Drift can show membrane, dosing, or feed water change |
| Hardness | Low after softener | Hardness leakage can damage downstream RO or boiler systems9 |
| Alarms | No repeated abnormal alarms | Repeated alarms show an operating problem even if water still flows |
I do not make a remote fault diagnosis from one screenshot. I ask for trends. I want the same data recorded at the same load, with the same sampling method, and over enough time to see direction. A stable system is not silent by accident. It shows control through repeatable values.
Why can factory testing not replace site validation?
Factory testing gives confidence, but site water gives the final answer. I have seen strong equipment face very different field conditions.
Factory tests verify equipment build quality, pressure resistance, basic function, flow, and sometimes desalination performance. Site validation confirms the full system under real feed water, local power, installation quality, operator practice, and project sampling requirements.
I separate manufacturing control from project acceptance
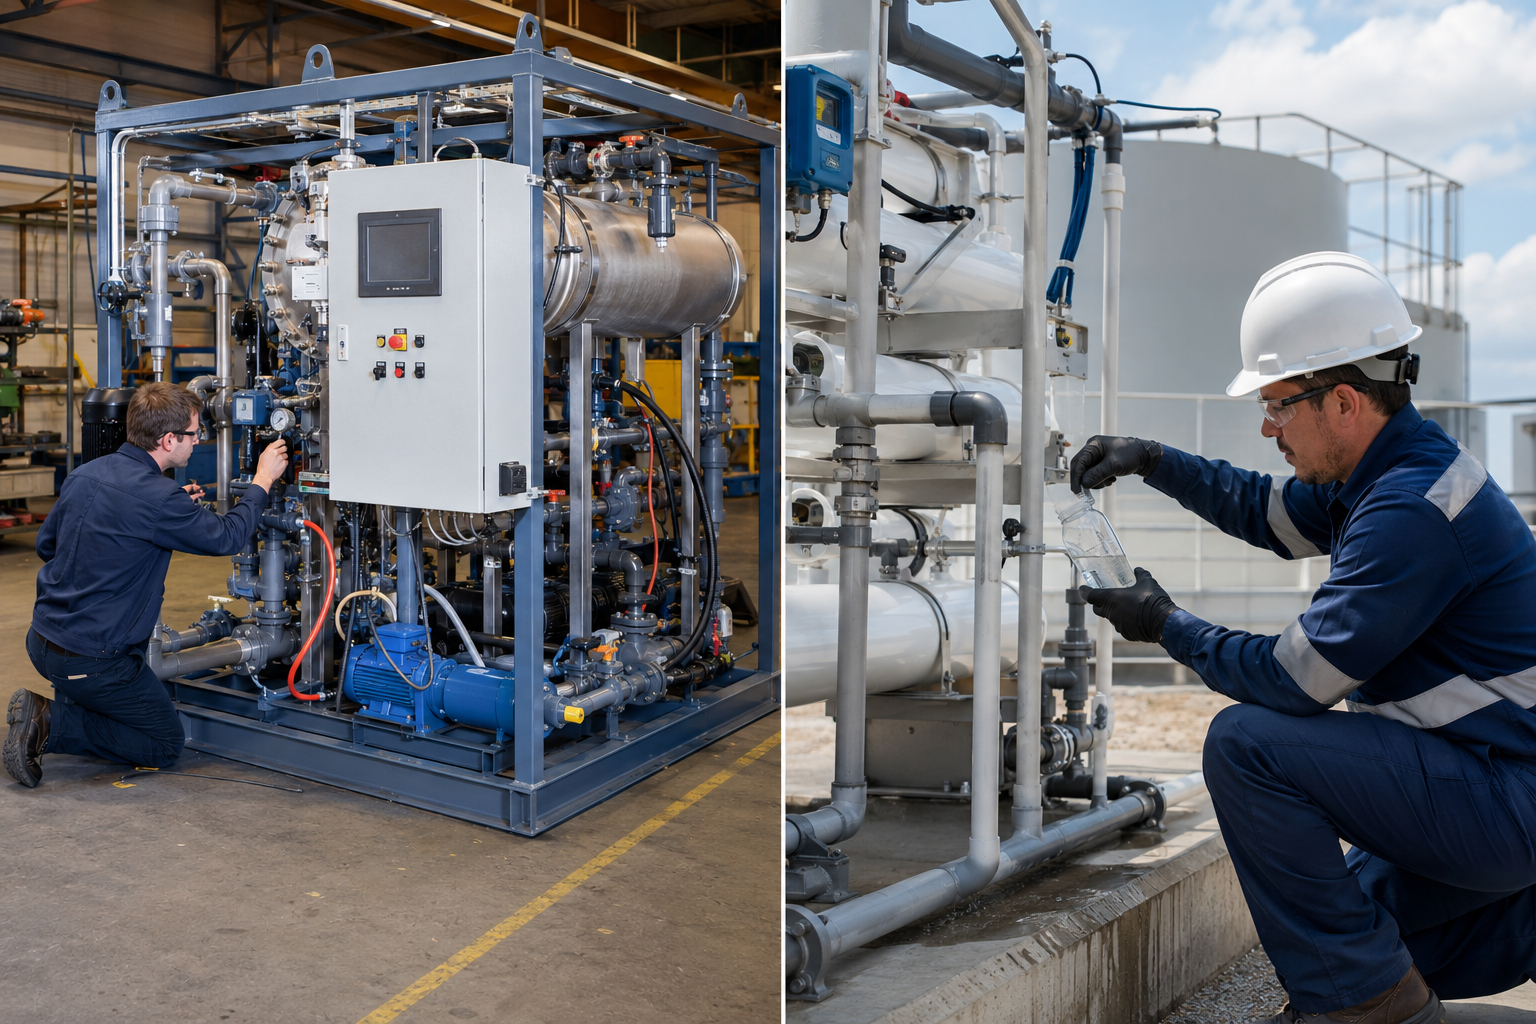
As a manufacturer and system supplier, I value factory testing. I see it as a necessary control point. Before shipment, equipment should not leave the factory without checks. For pressure vessels and membrane housings, I expect hydrostatic testing and pressure checks. For assembled systems, I expect function testing, wiring checks, pump rotation checks, valve operation checks, flow verification, and water quality checks when the test condition allows it.
But I do not say factory testing alone proves the final project result. The site may have different feed water. The inlet turbidity may be higher. The temperature may be lower. The available pressure may be unstable. The operator may open a bypass valve. A chemical dosing pump may be set at the wrong stroke. A sampling point may be installed at the wrong location. These details can change the result.
| Stage | What I verify | What I do not overclaim |
|---|---|---|
| Factory inspection | Build quality, assembly, pressure safety, control function | I do not claim full site performance under unknown feed water |
| Factory running test | Pump, valve, flow, alarm, basic water quality | I do not replace project sampling if site conditions differ |
| Site commissioning | Real installation, real feed water, real load | I do not ignore factory records |
| Site acceptance | Contract target, sampling report, operating stability | I do not accept only visual checks |
I prefer a clean handover chain. Factory reports support quality control. Site commissioning proves installation and operation. Site sampling proves whether the system meets the agreed project standard. These steps work together. They do not replace each other.
Why are clear water, taste, certificates, and one TDS reading not enough?
Simple signs feel reassuring. I understand that feeling, but I do not use them as final proof.
Clear water, better taste, certificates, and one TDS reading can support a first check, but they cannot prove long-term system performance. I still need design targets, correct sampling, operating logs, and trend data under normal load.
I treat quick checks as clues, not proof
I have heard many quick claims during project discussions. Someone says the water looks clean. Someone says the TDS meter shows a good number. Someone says the equipment has certificates. These points may matter, but they do not answer the full question. Clear water does not prove dissolved salt removal.10 Low TDS does not prove hardness control in every case. Good taste does not prove a system meets an industrial process requirement. A certificate does not prove the installed system is operating correctly today.
I separate visible comfort from technical acceptance.
| Quick sign | What it can suggest | What it cannot prove by itself |
|---|---|---|
| Clear water | Suspended solids may be low | Dissolved salts, hardness, microbiological condition, long-term stability |
| Better taste | Some contaminants may be reduced | Compliance with project or industrial water standards |
| One TDS reading | Salt level at one moment may be acceptable | Full RO health, recovery balance, membrane fouling trend |
| Certificate | Product design or material may meet a standard | Correct site installation and current performance |
| One lab report | Sample met a target at one time | Continuous operation under all normal conditions |
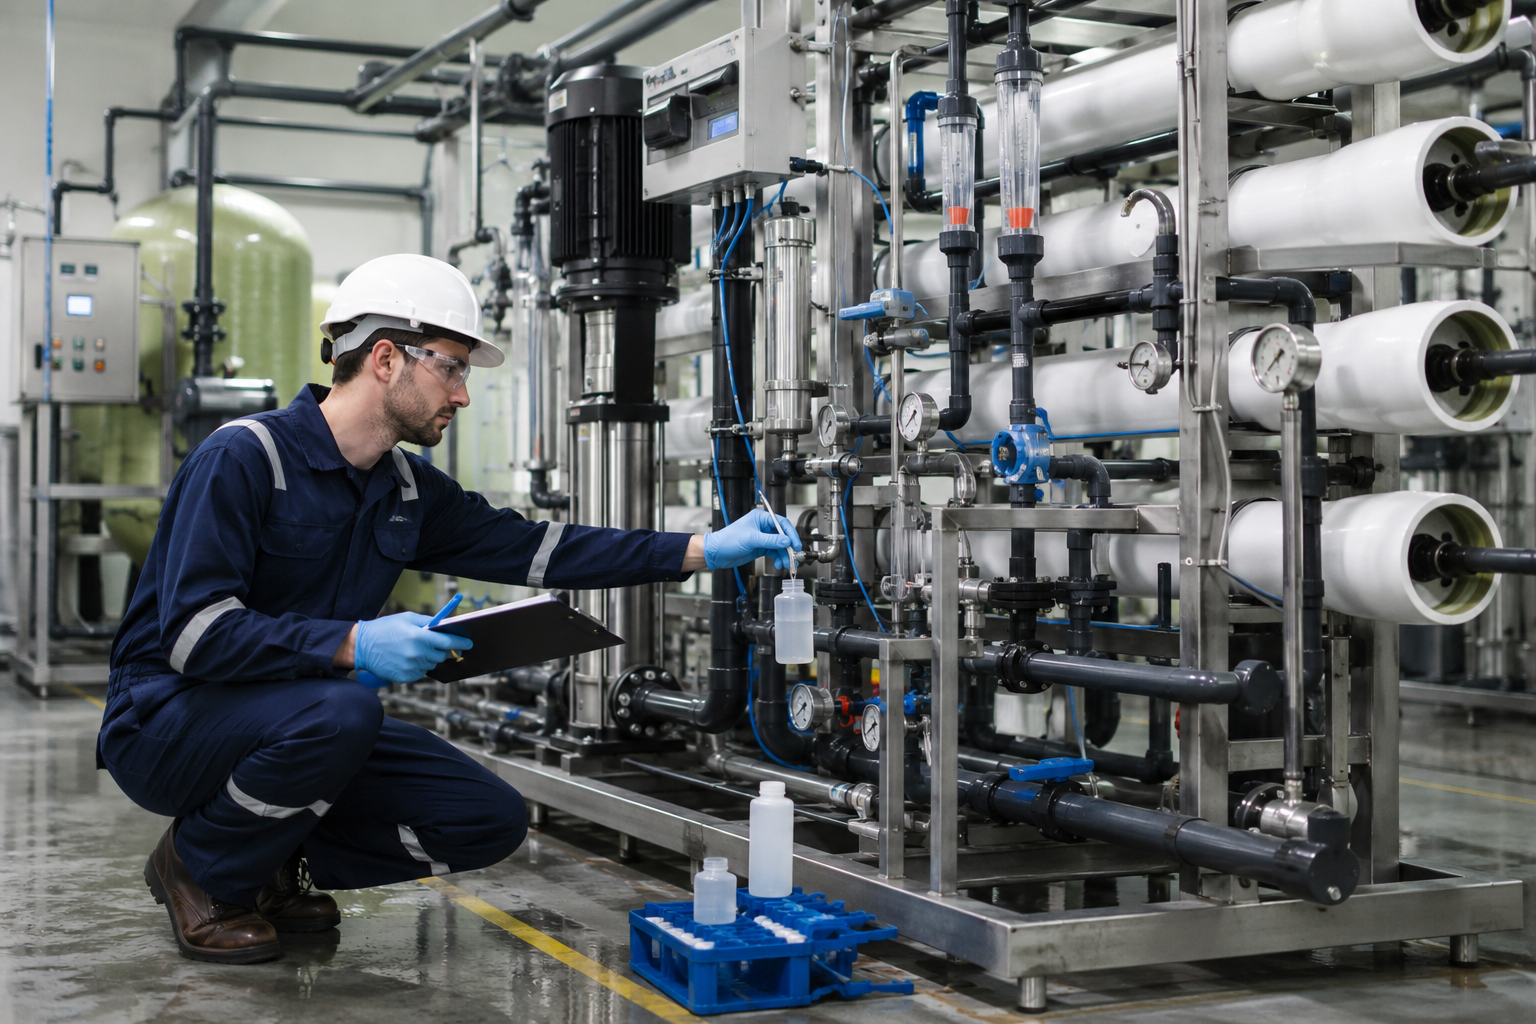
I also pay close attention to sampling. A sample from the wrong point can create a false pass.11 A sample taken after stagnant water can create a false fail. A sample taken during start-up flushing can also mislead the team. I prefer a sampling plan that names the point, time, operating condition, test method, and responsible party. That approach reduces argument and protects both the supplier and the project owner.
How should I review long-term trends before I accept the system?
Acceptance should not depend on luck. I want proof that the system can repeat its result under normal demand.
I review daily or shift-based logs for pressure, flow, recovery, product quality, alarms, backwash, regeneration, dosing, cleaning events, and feed water changes. A working system shows controlled values and explainable changes over time.
I look for direction, not only numbers
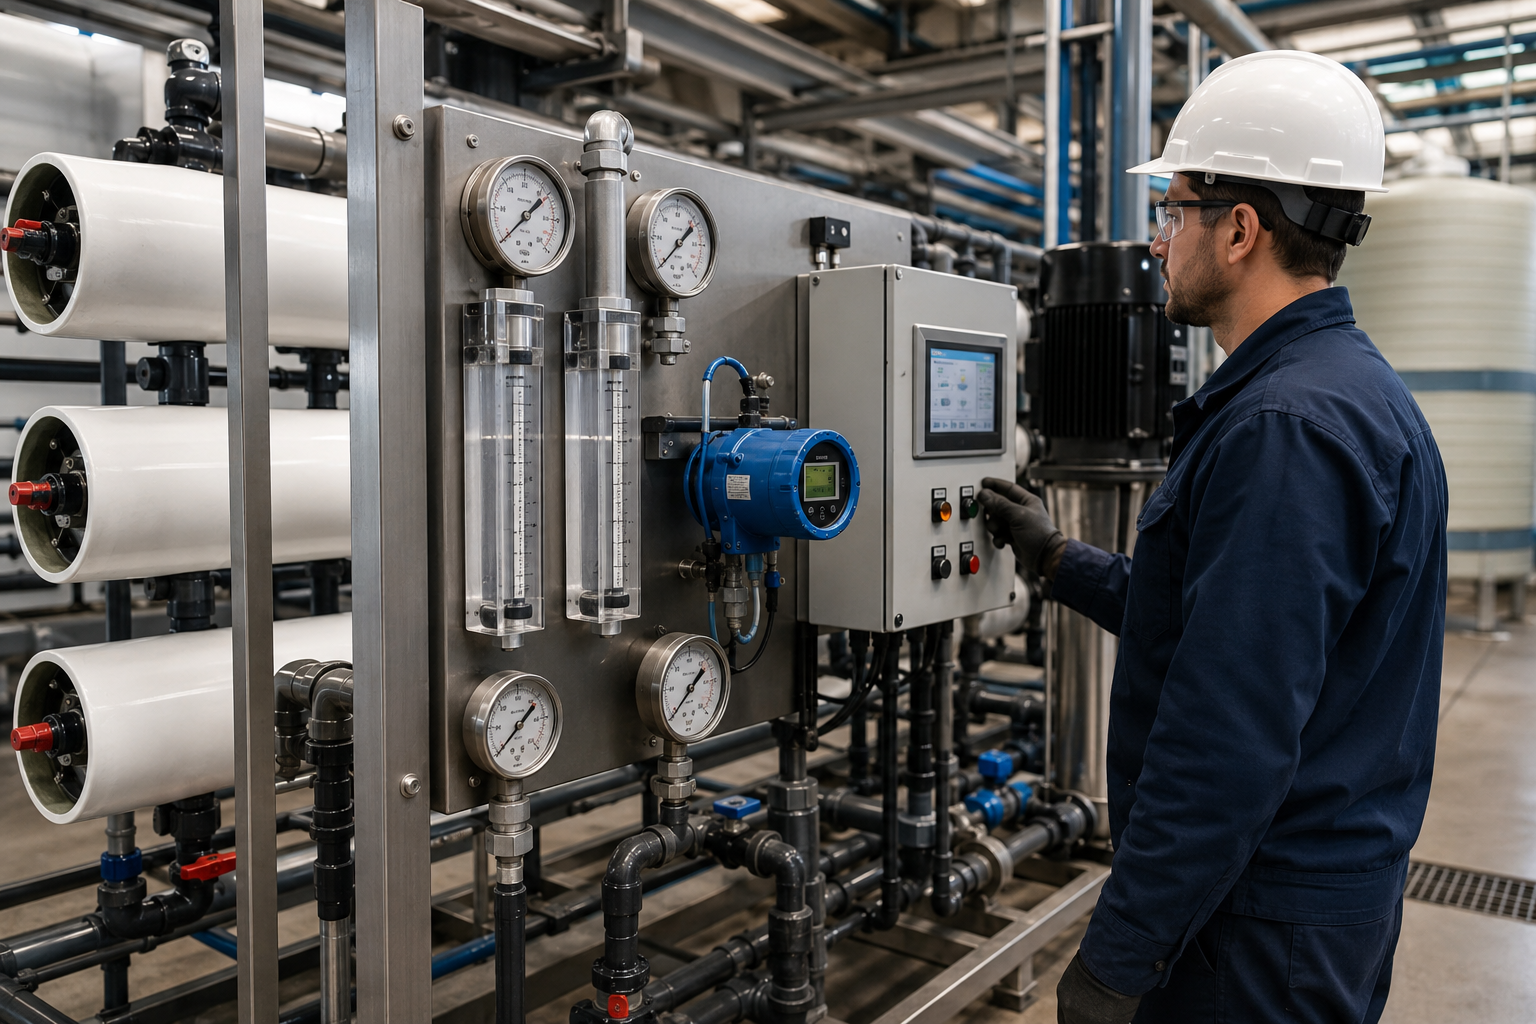
A single number tells me where the system was at one moment. A trend tells me where the system is going. In industrial and project water treatment, that difference matters. A membrane system may start well, then slowly lose flow. A filter may run well after backwash, then clog too quickly. A softener may pass hardness tests after regeneration, then leak hardness before the next planned cycle. These patterns show whether the system is truly stable.
I usually ask the site team to record data in a simple and consistent format.
| Log item | Normal use in my review | Warning pattern I watch |
|---|---|---|
| Feed pressure | Shows supply stability | Sudden drop or repeated fluctuation |
| Product flow | Shows output capacity | Slow decline at same pressure |
| Concentrate flow | Supports RO recovery check | Recovery rising without control |
| Pressure differential | Shows filter or membrane loading | Faster rise than design expectation |
| Product conductivity | Shows separation result | Gradual increase or sudden jump |
| Hardness after softener | Shows resin and regeneration performance | Leakage before expected service time |
| Backwash or cleaning record | Shows maintenance behavior | Too frequent or missing actions |
| Alarm record | Shows control stability | Repeated low pressure, high pressure, or water quality alarms |
I also compare trends with feed water changes. If the raw water becomes colder, membrane flow may drop.12 If turbidity rises after rain, the pretreatment load may increase. If the plant increases production hours, the system may face a higher duty cycle. I do not blame the equipment first, and I do not blame the operator first. I compare the trend with the design basis and the site condition. That makes the review fair.
What should I do when the system seems to be working but I still have doubts?
Doubt is useful when it leads to data. I prefer a careful review instead of fast blame or fast replacement.
I first confirm the design target, check the instruments, review operating logs, repeat sampling at the correct points, compare results with commissioning data, and involve the supplier, EPC, or owner team with shared records.

I build a simple review path
When a project owner or distributor asks me whether a system is working, I try to make the next step practical. I do not jump to replacement. I do not give a remote diagnosis without data. I start with a checklist that the site team can follow. This helps the discussion stay calm. It also helps the supplier, contractor, and owner find the real reason faster.
| Step | What I ask for | Why I ask |
|---|---|---|
| 1 | Design target and acceptance standard | I need to know what “pass” means |
| 2 | Current inlet and outlet water data | I need to see treatment effect |
| 3 | Flow, pressure, and recovery readings | I need to check operating condition |
| 4 | Alarm and maintenance history | I need to see repeated abnormal events |
| 5 | Commissioning and factory records | I need to compare present and baseline values |
| 6 | Sampling point photos or drawings | I need to avoid wrong sample conclusions |
| 7 | Recent feed water changes | I need to separate site change from equipment change |
I also recommend that teams agree on a short verification period when the issue is not urgent. For example, the operator may record data for several days at normal load. The team may repeat key water tests through the agreed sampling method. The supplier may review whether cleaning, regeneration, backwash, or dosing settings match the manual. This method is not dramatic, but it is reliable. It helps everyone decide whether the system is working, drifting, or needing adjustment.
Conclusion
I know a system is working when it meets its design target under real operating conditions and proves that result through records, testing, and trends.
"[PDF] ONSITE WATER TREATMENT SYSTEM", https://www.sfpuc.gov/sites/default/files/documents/CommissioningOnsiteWaterReuse_2022_Final.pdf. Water-treatment monitoring guidance treats performance as compliance with defined treatment objectives under specified operating conditions, using repeated operational and water-quality measurements rather than a single visual or analytical observation. Evidence role: expert_consensus; source type: government. Supports: Water treatment performance is evaluated against specified treatment objectives and monitored operating conditions rather than one isolated result.. Scope note: This supports the general verification principle but does not validate any particular system described in the article. ↩
"Drinking Water Treatment: Water Softening (Ion Exchange)", https://extensionpublications.unl.edu/assets/html/g1491/build/g1491.htm. Educational water-treatment references describe ion-exchange softening as a process that reduces hardness by exchanging calcium and magnesium ions, supporting outlet hardness as the appropriate performance measure for softeners. Evidence role: definition; source type: education. Supports: Water softeners are designed to reduce water hardness, primarily associated with calcium and magnesium ions.. ↩
"[PDF] Surface Water Treatment Rule Turbidity Guidance Manual - EPA", https://www.epa.gov/sites/default/files/2020-06/documents/swtr_turbidity_gm_final_508.pdf. Membrane-pretreatment literature commonly uses turbidity and the silt density index as indicators of particulate and fouling potential, supporting their use as filtration-related performance checks. Evidence role: general_support; source type: paper. Supports: Turbidity and SDI are commonly used as indicators of particulate loading and pretreatment quality, especially before membrane systems.. Scope note: SDI is an empirical fouling-potential test and does not directly identify all particle types or predict every fouling mechanism. ↩
"Prediction of Permeate Flux in Ultrafiltration Processes - PMC - NIH", https://pmc.ncbi.nlm.nih.gov/articles/PMC8158366/. Ultrafiltration studies define permeate flux and transmembrane pressure as core operating variables, with deviations in these parameters used to assess membrane resistance, fouling, and hydraulic performance. Evidence role: mechanism; source type: paper. Supports: UF membrane operation is characterized by permeate flux and transmembrane pressure, and changes in these values are associated with membrane loading or fouling.. ↩
"Drinking Water Treatment: Reverse Osmosis", https://extensionpubs.unl.edu/publication/g1490/na/html/view. Reverse-osmosis references characterize system performance through salt rejection, permeate quality, recovery, pressure, and flow, supporting the article's use of desalination and recovery as key RO verification measures. Evidence role: definition; source type: research. Supports: RO system performance is commonly described through salt rejection or permeate quality together with recovery and operating pressure or flow.. ↩
"Principle, techniques and factors influencing its performance", https://pubmed.ncbi.nlm.nih.gov/36372148/. Electrodeionization literature describes EDI as an ion-removal polishing process for RO permeate and reports product-water quality in terms of conductivity or resistivity, supporting resistivity as a performance indicator. Evidence role: mechanism; source type: paper. Supports: EDI removes ions from RO permeate and high-purity product water is commonly monitored by resistivity or conductivity.. ↩
"[PDF] Surface Water Treatment Rule", https://www.doh.wa.gov/portals/1/Documents/pubs/331-085.pdf. Water-treatment engineering references show that hydraulic loading, contact time, and membrane loading vary with flow rate, so a unit verified at partial flow may not demonstrate equivalent performance at design or peak flow. Evidence role: mechanism; source type: education. Supports: Treatment performance depends on hydraulic loading, contact time, membrane loading, or similar flow-related operating conditions.. Scope note: The source would support the mechanism generally; failure at full flow depends on the system design and contaminant load. ↩
"Investigation of Scaling and Inhibition Mechanisms in Reverse ...", https://pmc.ncbi.nlm.nih.gov/articles/PMC9505956/. Reverse-osmosis scaling studies explain that increasing recovery raises the concentration factor for sparingly soluble salts, which can increase supersaturation and scaling risk on membrane surfaces. Evidence role: mechanism; source type: paper. Supports: Higher RO recovery concentrates sparingly soluble salts near or beyond saturation, increasing the likelihood of mineral scaling.. ↩
"Hardness of Water | U.S. Geological Survey - USGS", https://www.usgs.gov/water-science-school/science/hardness-water. Water-treatment and boiler-water references identify calcium and magnesium hardness as major contributors to mineral scale, supporting the concern that hardness leakage can impair downstream RO membranes or boiler operation. Evidence role: mechanism; source type: government. Supports: Hardness ions can form scale in boilers and contribute to scaling or fouling risks in downstream membrane systems.. Scope note: The severity of damage depends on concentration, temperature, recovery, antiscalant control, and operating duration. ↩
"Turbidity and Water | U.S. Geological Survey - USGS", https://www.usgs.gov/water-science-school/science/turbidity-and-water. Government water-quality references distinguish turbidity, which reflects suspended particles and light scattering, from dissolved solids, supporting the statement that visually clear water may still contain dissolved salts. Evidence role: definition; source type: government. Supports: Turbidity or visual clarity relates mainly to suspended particles, while dissolved solids are measured separately by TDS or conductivity.. ↩
"Handbook for Sampling and Sample Preservation of Water and ...", https://nepis.epa.gov/Exe/ZyPURL.cgi?Dockey=30000QSA.TXT. Water-quality sampling guidance emphasizes representative sampling locations, documented procedures, and avoidance of conditions that bias samples, supporting the claim that an incorrect sampling point can produce a misleading pass result. Evidence role: expert_consensus; source type: government. Supports: Representative water-quality sampling requires defined sampling locations and procedures; inappropriate points can bias results.. ↩
"[PDF] Feed Temperature Effects on Organic Fouling of Reverse Osmosis ...", https://www.lccmr.mn.gov/projects/2016/finals/2016_06b_rpt_bin_ahmed_etal_2021_manuscript.pdf. Membrane-performance studies and RO design references report that lower feed-water temperature reduces permeate flow because water viscosity increases and effective membrane permeability decreases. Evidence role: mechanism; source type: paper. Supports: As water temperature decreases, viscosity increases and membrane permeate flux or flow can decrease under otherwise similar operating conditions.. ↩